The season in data
Europe’s 2025 wildfire season in five charts
More than a million hectares burned in the EU. Five charts show where the damage fell, when it happened and the conditions behind an exceptional season.
Europe’s 2025 wildfire season was exceptional, but one headline number cannot explain it. The area burned, the timing of the fires and the weather each reveal a different part of the story.
These five charts use EFFIS and Copernicus data. The first three cover the European Union’s 27 countries. The last two use their own stated regions. “Europe” does not mean the same boundary in every dataset.
1. The EU passed a million hectares
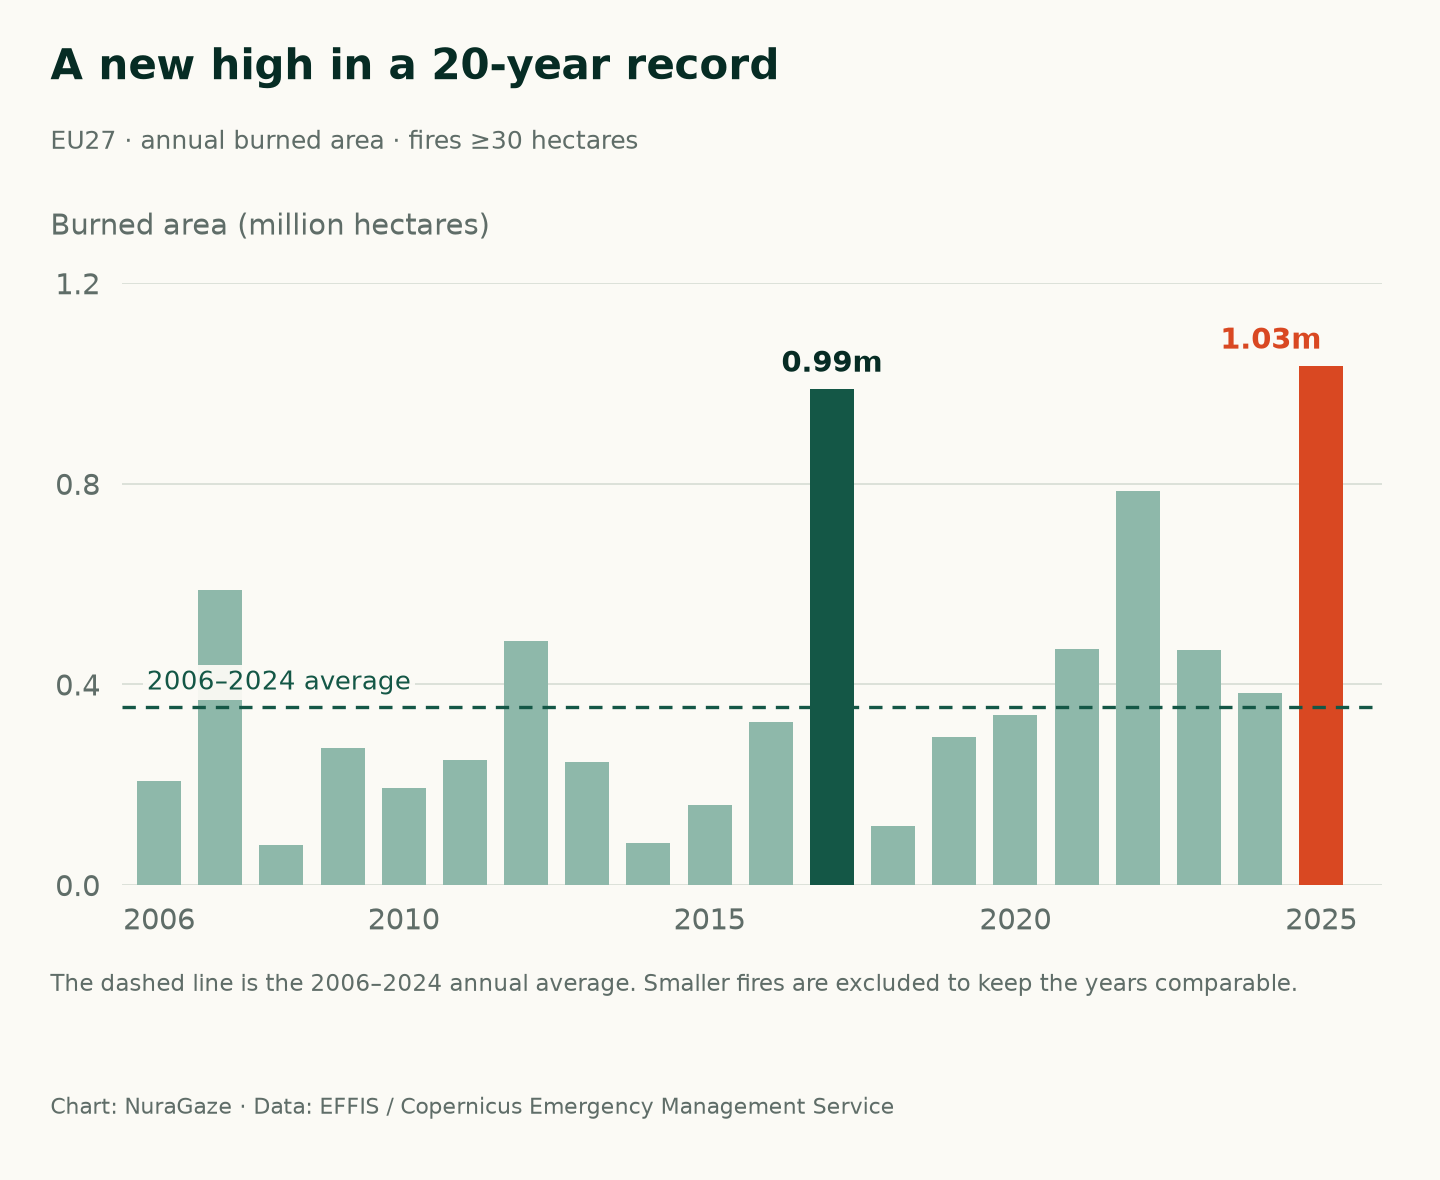
Fires of at least 30 hectares burned 1,034,552 hectares across the EU in 2025. That is roughly 10,346 square kilometres. It was the largest annual total in this EFFIS series, which begins in 2006, and about 2.9 times the 2006–2024 average.
The previous peak was 2017. Several quieter years sit between the peaks, a reminder that a record season and a long-term trend are different questions. Our guide to whether wildfires are getting worse explores that distinction.
Chart 1 / 5
A new high in a 20-year record
EU27 · annual burned area · fires ≥30 hectares

View chart 1 data & downloads
Download data (CSV) · Download chart (PNG)
| Year | Burned area (ha) |
|---|---|
| 2006 | 207,205 |
| 2007 | 588,128 |
| 2008 | 79,041 |
| 2009 | 273,739 |
| 2010 | 194,169 |
| 2011 | 249,847 |
| 2012 | 485,648 |
| 2013 | 245,356 |
| 2014 | 83,576 |
| 2015 | 160,320 |
| 2016 | 325,857 |
| 2017 | 988,524 |
| 2018 | 117,356 |
| 2019 | 295,835 |
| 2020 | 339,767 |
| 2021 | 471,045 |
| 2022 | 785,549 |
| 2023 | 467,729 |
| 2024 | 383,317 |
| 2025 | 1,034,552 |
2. Spain and Portugal carried much of the loss
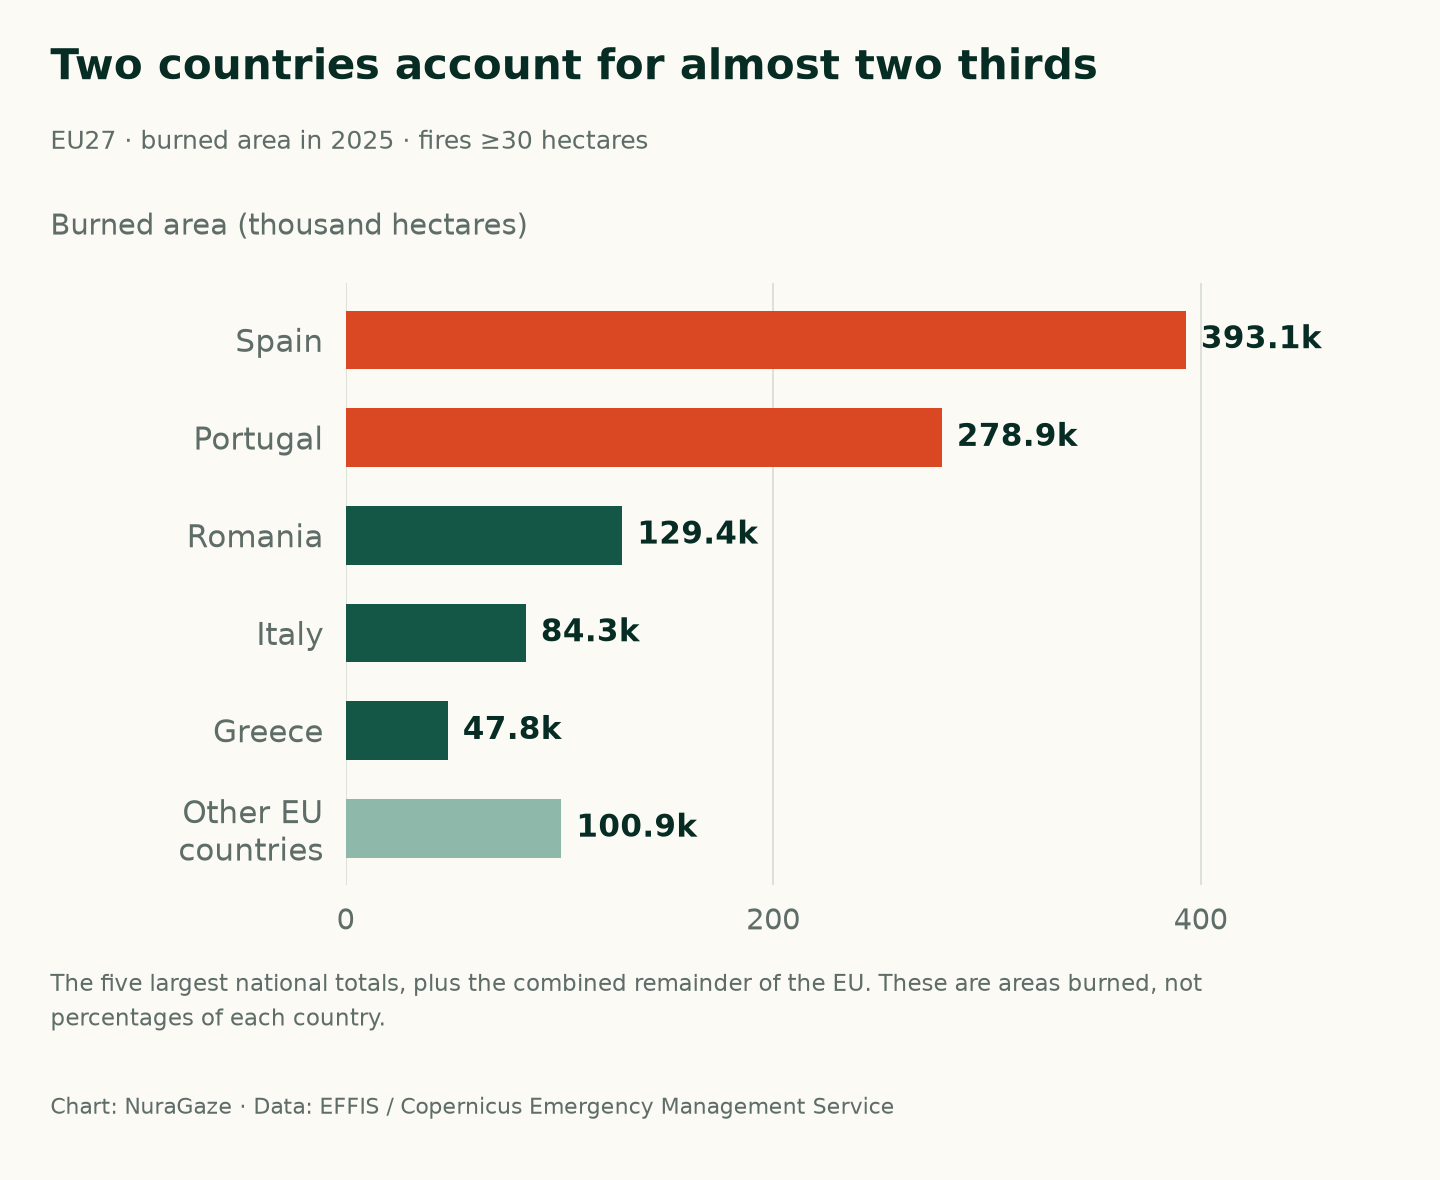
Spain recorded about 393,000 hectares burned and Portugal about 279,000 in the same dataset. Together, they accounted for 65% of the EU total. Romania, Italy and Greece followed.
This chart measures area, not the proportion of a country affected. It also cannot tell us how many homes were lost or how severely a particular habitat burned. Those require different evidence.
Chart 2 / 5
Two countries account for almost two thirds
EU27 · burned area in 2025 · fires ≥30 hectares

View chart 2 data & downloads
Download data (CSV) · Download chart (PNG)
| Country / group | Burned area (ha) |
|---|---|
| Spain | 393,079 |
| Portugal | 278,917 |
| Romania | 129,443 |
| Italy | 84,348 |
| Greece | 47,819 |
| Other EU countries | 100,946 |
3. August transformed the season
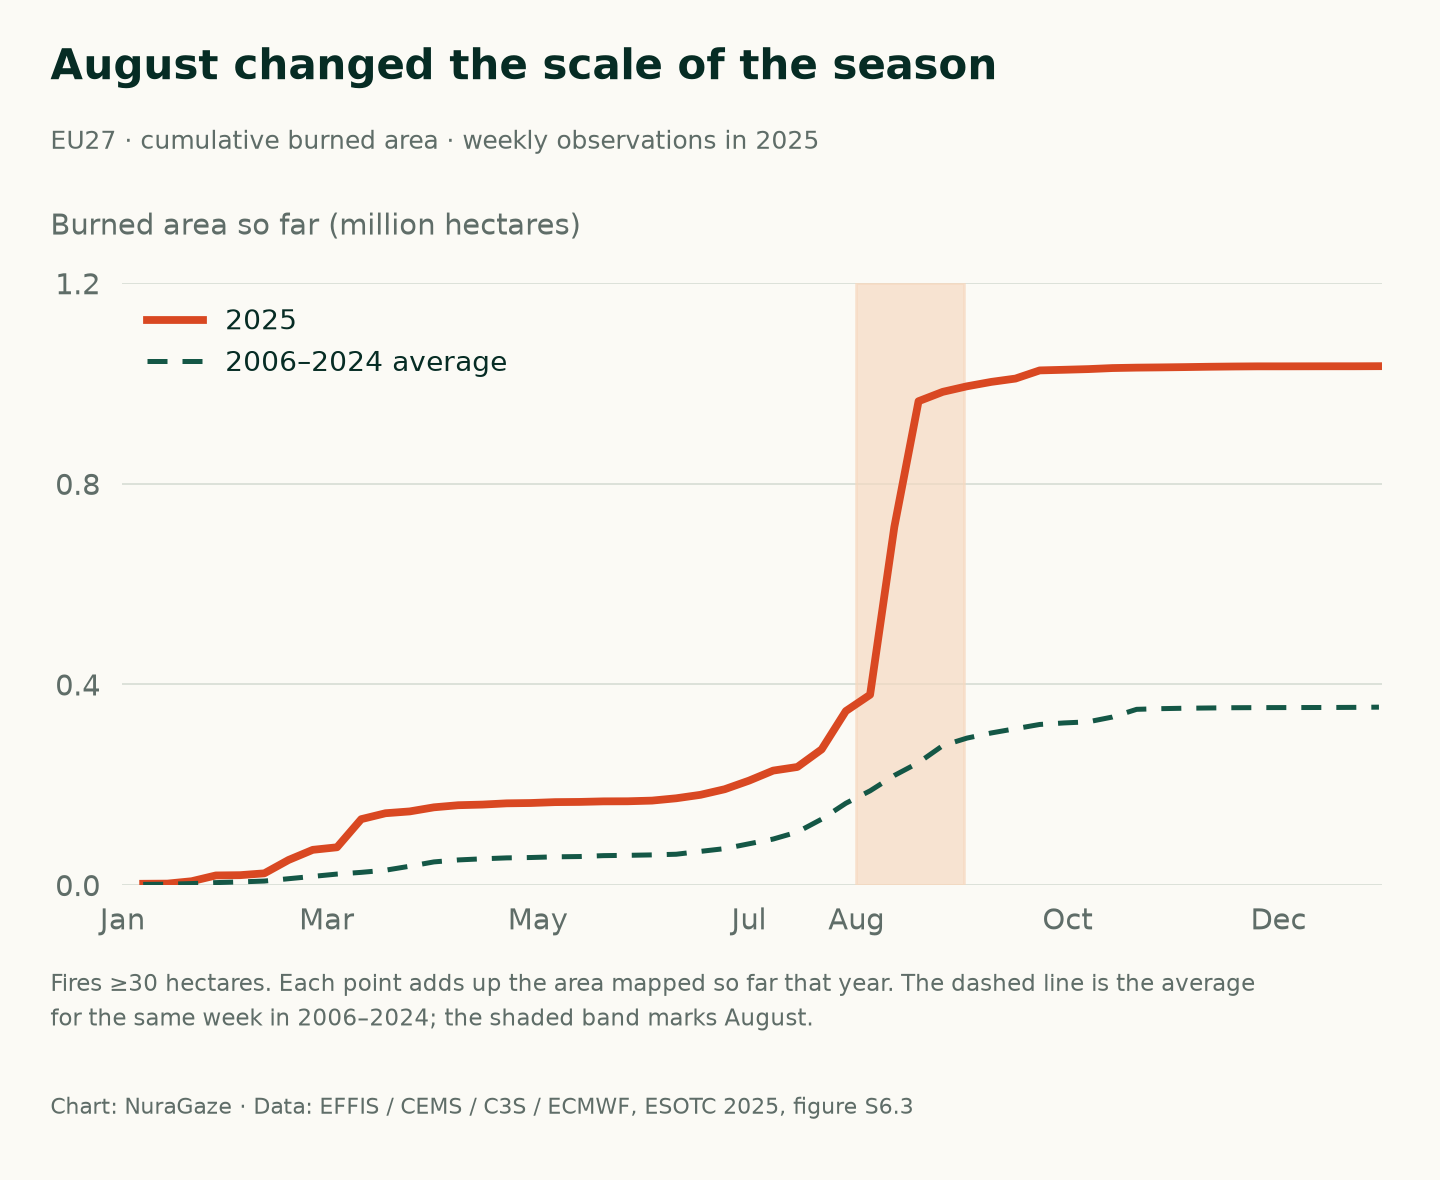
The cumulative total had already passed 100,000 hectares by the weekly observation on 11 March. Then came the steep summer rise: between 5 and 19 August, the mapped total increased by about 585,000 hectares.
By 26 August, about 95% of the year’s total had been mapped. The slope shows how much damage can accumulate in a short period. It does not measure the speed of an individual fire.
Chart 3 / 5
August changed the scale of the season
EU27 · cumulative burned area · weekly observations in 2025

View chart 3 data & downloads
Download data (CSV) · Download chart (PNG)
| Week ending | 2025 (ha) | 2006–2024 average (ha) |
|---|---|---|
| 07/01/2025 | 2,455 | 1,171.31 |
| 14/01/2025 | 2,763 | 1,530.67 |
| 21/01/2025 | 7,505 | 2,830.37 |
| 28/01/2025 | 19,039 | 4,761.01 |
| 04/02/2025 | 19,597 | 6,159.54 |
| 11/02/2025 | 23,259 | 7,869.78 |
| 18/02/2025 | 49,893 | 12,532.35 |
| 25/02/2025 | 70,125 | 17,137.18 |
| 04/03/2025 | 75,212 | 21,796.08 |
| 11/03/2025 | 131,296 | 25,206.19 |
| 18/03/2025 | 143,096 | 29,497.07 |
| 25/03/2025 | 146,724 | 37,417.55 |
| 01/04/2025 | 154,891 | 46,052.54 |
| 08/04/2025 | 159,079 | 49,988.26 |
| 15/04/2025 | 160,344 | 52,226.59 |
| 22/04/2025 | 162,850 | 54,065.18 |
| 29/04/2025 | 163,492 | 54,810.44 |
| 06/05/2025 | 165,258 | 56,182.02 |
| 13/05/2025 | 165,648 | 56,757.81 |
| 20/05/2025 | 166,775 | 58,565.66 |
| 27/05/2025 | 166,951 | 59,167.75 |
| 03/06/2025 | 168,294 | 60,020.91 |
| 10/06/2025 | 172,914 | 61,333.11 |
| 17/06/2025 | 179,813 | 67,048.38 |
| 24/06/2025 | 190,983 | 72,552.44 |
| 01/07/2025 | 208,037 | 82,153.34 |
| 08/07/2025 | 228,098 | 91,623.96 |
| 15/07/2025 | 235,360 | 105,595.39 |
| 22/07/2025 | 270,449 | 131,289.95 |
| 29/07/2025 | 346,836 | 162,999.99 |
| 05/08/2025 | 379,392 | 187,771.72 |
| 12/08/2025 | 713,870 | 218,422.89 |
| 19/08/2025 | 964,680 | 244,017.24 |
| 26/08/2025 | 983,367 | 277,985.14 |
| 02/09/2025 | 994,419 | 292,945.07 |
| 09/09/2025 | 1,003,182 | 303,171.39 |
| 16/09/2025 | 1,009,828 | 311,668.05 |
| 23/09/2025 | 1,026,104 | 320,105.85 |
| 30/09/2025 | 1,027,351 | 323,143.84 |
| 07/10/2025 | 1,028,701 | 325,351.31 |
| 14/10/2025 | 1,030,778 | 334,923.05 |
| 21/10/2025 | 1,031,643 | 350,273.01 |
| 28/10/2025 | 1,032,128 | 351,640.85 |
| 04/11/2025 | 1,032,700 | 352,480.48 |
| 11/11/2025 | 1,033,401 | 353,003.23 |
| 18/11/2025 | 1,033,895 | 353,495.07 |
| 25/11/2025 | 1,034,229 | 353,700.29 |
| 02/12/2025 | 1,034,229 | 353,788.03 |
| 09/12/2025 | 1,034,305 | 353,884.03 |
| 16/12/2025 | 1,034,377 | 353,982.34 |
| 23/12/2025 | 1,034,377 | 354,192.65 |
| 30/12/2025 | 1,034,552 | 354,638.11 |
4. The emissions peak was even more concentrated
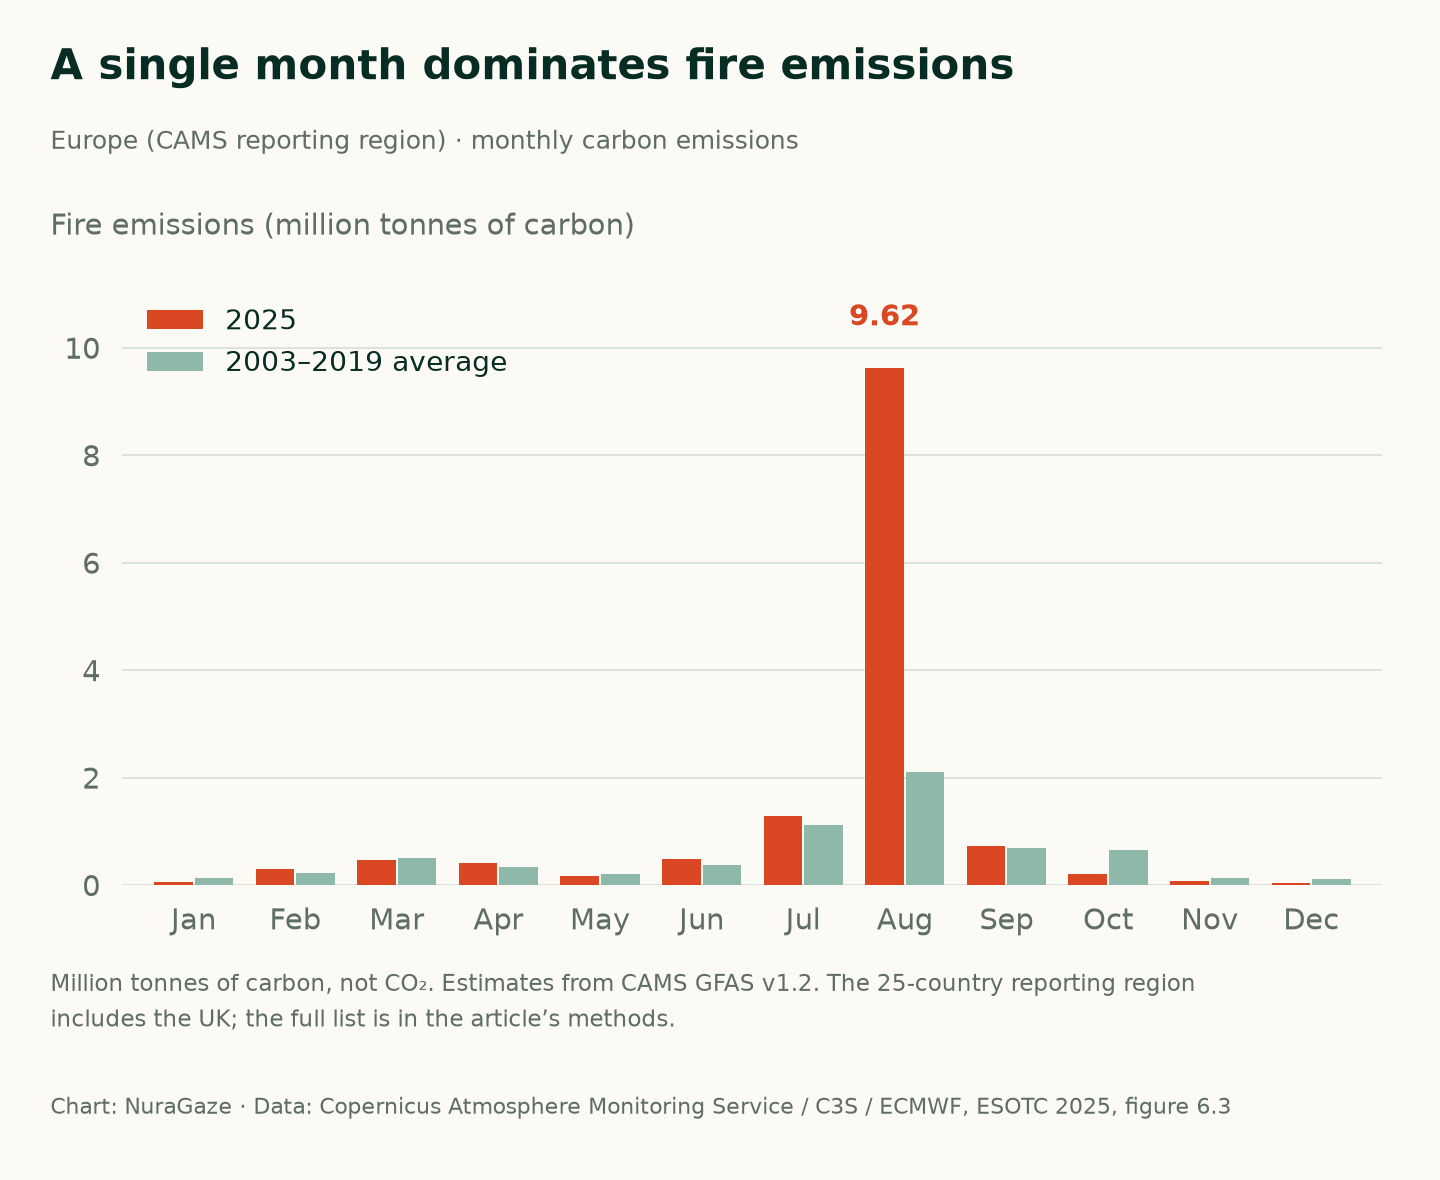
In the Copernicus Atmosphere Monitoring Service’s European reporting region, August fires released an estimated 9.62 million tonnes of carbon. That was about 4.6 times the August average for 2003–2019.
August accounted for around 70% of the region’s estimated annual fire carbon emissions. This is a different measure from burned area. It is also carbon, not tonnes of carbon dioxide, and does not directly measure the air pollution someone breathed.
Chart 4 / 5
A single month dominates fire emissions
Europe (CAMS reporting region) · monthly carbon emissions

View chart 4 data & downloads
Download data (CSV) · Download chart (PNG)
| Month | 2025 (Mt carbon) | 2003–2019 average (Mt carbon) |
|---|---|---|
| Jan | 0.06 | 0.132 |
| Feb | 0.301 | 0.223 |
| Mar | 0.457 | 0.5 |
| Apr | 0.415 | 0.34 |
| May | 0.161 | 0.208 |
| Jun | 0.489 | 0.373 |
| Jul | 1.284 | 1.123 |
| Aug | 9.616 | 2.111 |
| Sep | 0.723 | 0.697 |
| Oct | 0.202 | 0.643 |
| Nov | 0.073 | 0.134 |
| Dec | 0.036 | 0.11 |
5. Northwestern Iberia faced unusually severe conditions
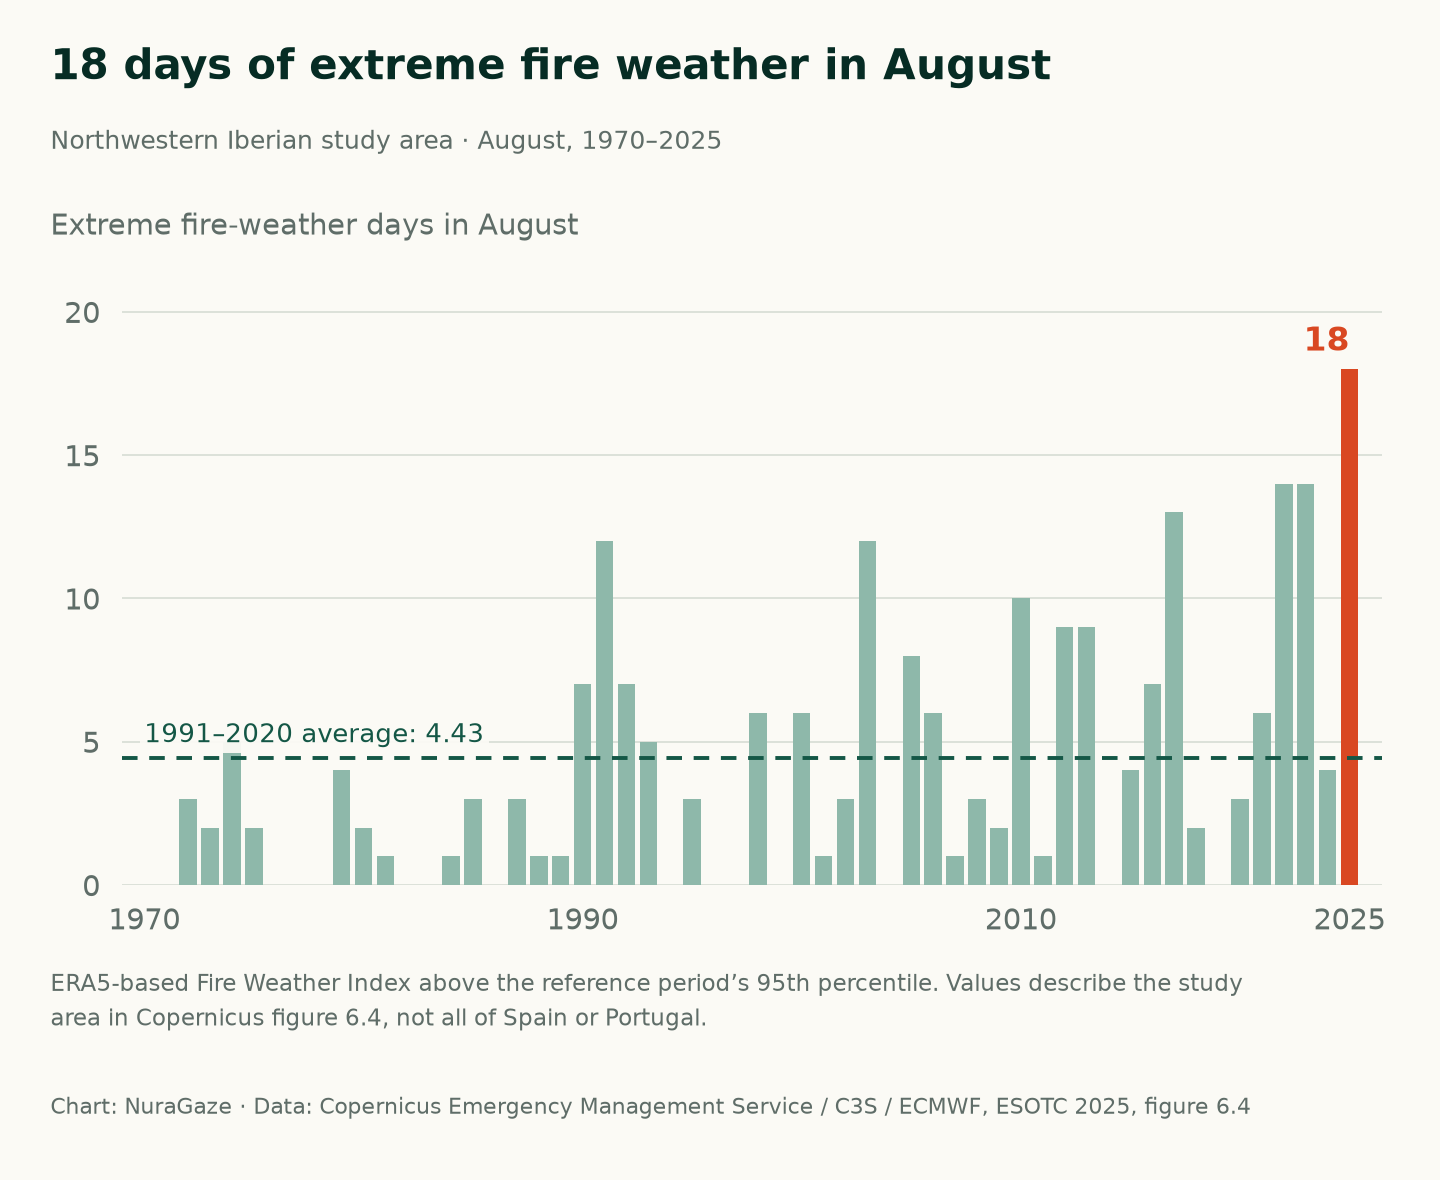
A Copernicus study area spanning parts of northwestern Spain and northern Portugal recorded 18 extreme fire-weather days in August. Its 1991–2020 August average was about 4.4 days.
Here, “extreme” means the Fire Weather Index exceeded the reference period’s 95th percentile: the threshold for its highest 5% of values. This describes conditions that can favour fire. It does not count ignitions, and it is not a figure for the whole Iberian Peninsula.
Chart 5 / 5
18 days of extreme fire weather in August
Northwestern Iberian study area · August, 1970–2025

View chart 5 data & downloads
Download data (CSV) · Download chart (PNG)
| Year | Extreme days in August |
|---|---|
| 1970 | 0 |
| 1971 | 0 |
| 1972 | 3 |
| 1973 | 2 |
| 1974 | 5 |
| 1975 | 2 |
| 1976 | 0 |
| 1977 | 0 |
| 1978 | 0 |
| 1979 | 4 |
| 1980 | 2 |
| 1981 | 1 |
| 1982 | 0 |
| 1983 | 0 |
| 1984 | 1 |
| 1985 | 3 |
| 1986 | 0 |
| 1987 | 3 |
| 1988 | 1 |
| 1989 | 1 |
| 1990 | 7 |
| 1991 | 12 |
| 1992 | 7 |
| 1993 | 5 |
| 1994 | 0 |
| 1995 | 3 |
| 1996 | 0 |
| 1997 | 0 |
| 1998 | 6 |
| 1999 | 0 |
| 2000 | 6 |
| 2001 | 1 |
| 2002 | 3 |
| 2003 | 12 |
| 2004 | 0 |
| 2005 | 8 |
| 2006 | 6 |
| 2007 | 1 |
| 2008 | 3 |
| 2009 | 2 |
| 2010 | 10 |
| 2011 | 1 |
| 2012 | 9 |
| 2013 | 9 |
| 2014 | 0 |
| 2015 | 4 |
| 2016 | 7 |
| 2017 | 13 |
| 2018 | 2 |
| 2019 | 0 |
| 2020 | 3 |
| 2021 | 6 |
| 2022 | 14 |
| 2023 | 14 |
| 2024 | 4 |
| 2025 | 18 |
What this means for planning
For landowners and site managers, the practical lesson is to prepare before the busiest weeks arrive. Review the areas you need to watch, who checks an alert and how information reaches the people responsible for responding.
These charts cannot establish how much damage any detection product would have prevented. They do show why readiness matters. Our guides to comparing detection methods and the first few minutes of a wildfire explain the next questions to ask.
How to read the figures
Data retrieved on 28 October 2026. Charts are redrawn by NuraGaze; percentages and ratios are our calculations. Downloads retain the source values.
Coverage, definitions & data sources
Burned area: charts 1–3 use EFFIS’s 30-hectare threshold for historical comparability. The JRC’s 2025 advance report gives a larger EU total of 1,079,538 hectares when smaller mapped fires are included. These totals describe different sets of fires. The mapping includes natural vegetation beyond forests and can include prescribed burns. Chart 3 uses the published weekly series ending 30 December; its weekly historical averages differ slightly from complete-calendar-year averages.
Emissions: chart 4 uses CAMS GFAS v1.2 estimates and the source’s 2003–2019 monthly baseline. Its 25-country region is Austria, Bulgaria, Croatia, Cyprus, Czechia, Denmark, Estonia, Finland, France, Germany, Greece, Hungary, Ireland, Italy, Latvia, Lithuania, the Netherlands, Poland, Portugal, Romania, Slovakia, Slovenia, Spain, Sweden and the United Kingdom.
Fire weather: chart 5 uses the published regional series for the study area shown in Copernicus figure 6.4. It uses ERA5-based Fire Weather Index data, a percentile threshold and a 1991–2020 reference period. It is not the separate measure of days with an absolute index of 50 or more.

Sources & further reading
- Seasonal trends: annual and national burned-area estimates European Forest Fire Information System (EFFIS), accessed 28 October 2026
- Advance report on forest fires in Europe, Middle East and North Africa 2025 European Commission Joint Research Centre, 31 March 2026; methodology on page 8
- Wildfires: burned area, emissions and fire weather Copernicus European State of the Climate 2025; figures S6.3, 6.3 and 6.4
Charts 1–3 contain adapted EFFIS data, © European Union, licensed under CC BY 4.0. Charts 3–5 contain modified Copernicus Climate Change Service and Atmosphere Monitoring Service information (2026). Neither the European Commission nor ECMWF is responsible for the use made of that information here.
NuraGaze provides wildfire early-warning software and monitoring systems. This article explains public data; it is not an evaluation of product performance.