Wildfire trends
Are wildfires getting worse? Four measures that tell different stories
The area burned, extreme fire events, carbon emissions and losses each reveal a different part of the picture. Here’s how to read the evidence.
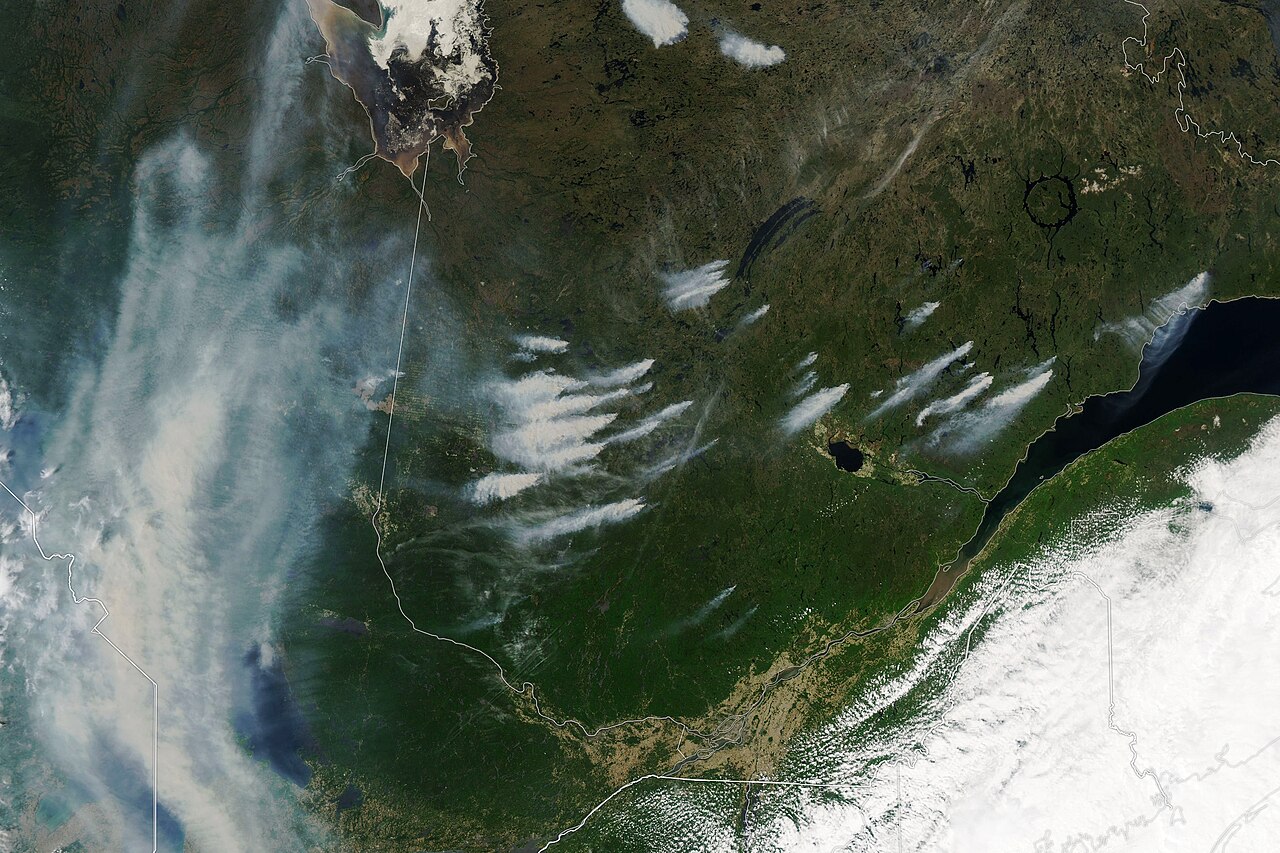

Several important measures of wildfire activity and damage have worsened, particularly in some forest regions. Yet the total area burned worldwide has fallen in some long-term records. Both findings can be true. They measure different things, in different places and over different periods.
To understand whether wildfires are getting worse, start by asking what “worse” means. More land burned, more extreme events, greater carbon emissions and greater harm to people each answer a different question.
| Measure | Reported finding | Scope and period |
|---|---|---|
| Burned area | 24% decline | Global vegetation fires, 1998–2015. |
| Extreme events | 2.2 times the frequency | Most energetic daily fire events globally, 2003–2023. |
| Carbon emissions | 60% increase | Fire emissions from forest ecoregions globally, 2001–2023. |
| Economic disasters | 43% in the final decade | Of 200 ranked damaging events in 1980–2023, 43% occurred in 2014–2023. |
1. Burned area: how much land burns
Burned area measures the extent of land affected by fire. Global satellite totals include grasslands and savannas, where some burning is deliberate land management. They are not simply a count of uncontrolled forest fires.
A NASA-supported study reported a 24% decline in global burned area between 1998 and 2015. Changes in agriculture and settlement patterns helped explain the reduction. Less burning across extensive grassy landscapes can outweigh an increase elsewhere.
That finding describes a particular historical period. It does not establish a continuing decline through 2026, or show that every region became safer. A global total can conceal a very different local experience.
2. Extreme events: the most energetic fires
Another approach examines the most exceptional events. A 2024 satellite study grouped fire detections into daily events and ranked their combined radiative power: the heat output observed from space.
For the most energetic 0.01% of events, the estimated frequency increased 2.2-fold between 2003 and 2023. The strongest increases were in northern forests and temperate forests dominated by conifers, such as pine and spruce.
This does not mean all wildfires doubled, or flames became twice as hot. A later critique and the authors’ reply debate how to interpret this measure. The distinction matters: combined heat output can reflect fire size and simultaneous burning, as well as how intensely a particular area burns.
3. Carbon emissions: what burning releases
Equal areas of grassland and dense forest do not contain the same amount of burnable material. Emissions therefore depend on what burns and how much is consumed, as well as the area affected.
A 2024 study found a 60% increase in fire carbon emissions from forest ecoregions globally during 2001–2023. Increases outside the tropics outweighed declines within tropical regions. The researchers linked the changes to fire-favourable weather, vegetation and human influences, highlighting forests’ growing vulnerability under climate change.
A more recent season illustrates the distinction. The State of Wildfires 2024–2025 report found global burned area 9% below average for March 2024–February 2025. Yet fire carbon emissions were 9% above average. The respective baselines cover earlier seasons since 2002 and 2003; this is a seasonal comparison, not a trend estimate.
4. Harm to people: what a fire reaches
Deaths, destroyed homes and financial losses describe consequences that a burned-area map cannot capture. A fire reaching a populated place can cause enormous damage without being one of the largest by area.
A 2025 study of wildfire disasters examined records from 1980 to 2023. Of the 200 most damaging events in its economic ranking, 43% occurred in the final decade, 2014–2023. Disaster risk was greatest where highly energetic fires intersected populated areas with valuable assets.
This is a finding about selected recorded disasters, not all fires. Losses depend on exposure and vulnerability as well as fire behaviour. No single financial measure captures every consequence for people or ecosystems.
What do the trends mean locally?
Read any wildfire statistic with three questions: what was measured, where, and over which years? Check whether it describes an observed trend, one unusual season or a future projection.
For a site manager, global averages provide context. Decisions need local information about vegetation, weather, nearby people and assets, and the ability to respond. Our guides to detection methods and the first few minutes of a wildfire explain how earlier information can support that response.
Sources & further reading
- Researchers Detect a Global Drop in Fires NASA Earth Observatory (2017), reporting Andela and colleagues
- Increasing frequency and intensity of the most extreme wildfires on Earth Cunningham and colleagues, Nature Ecology & Evolution (2024)
- Increases in the world’s most extreme wildfire events probably driven by fire size and simultaneity Schütze and Resco de Dios, Nature Ecology & Evolution (2025)
- Reply to: Increases in the world’s most extreme wildfire events probably driven by fire size and simultaneity Cunningham and colleagues, Nature Ecology & Evolution (2025)
- Global rise in forest fire emissions linked to climate change in the extratropics Jones and colleagues, Science (2024); University of East Anglia research record
- State of Wildfires 2024–2025 Kelley and colleagues, Earth System Science Data (2025)
- Climate-linked escalation of societally disastrous wildfires Cunningham and colleagues, Science (2025); abstract via PubMed
NuraGaze provides wildfire early-warning software and monitoring systems. This explainer summarises the cited evidence and its limits. Global findings are not forecasts for an individual site.