Nature in numbers
How much of Europe’s burned land is protected nature?
Nearly two-fifths of the EU’s mapped burned area in 2025 lay within Natura 2000 sites. The figures show how closely wildfire management and nature conservation are connected.
The 2025 figures
In 2025, fires burned 424,023 hectares within Natura 2000, the European Union’s network of protected natural sites. That accounted for approximately 39% of all the land mapped as burned across the EU that year, according to the European Commission’s Joint Research Centre.
Put simply, for every 100 hectares that burned, about 39 were inside this conservation network.

| Area | Hectares | Share |
|---|---|---|
| Within Natura 2000 sites | 424,023 | 39.3% |
| Outside Natura 2000 sites | 655,515 | 60.7% |
| Total | 1,079,538 | 100% |
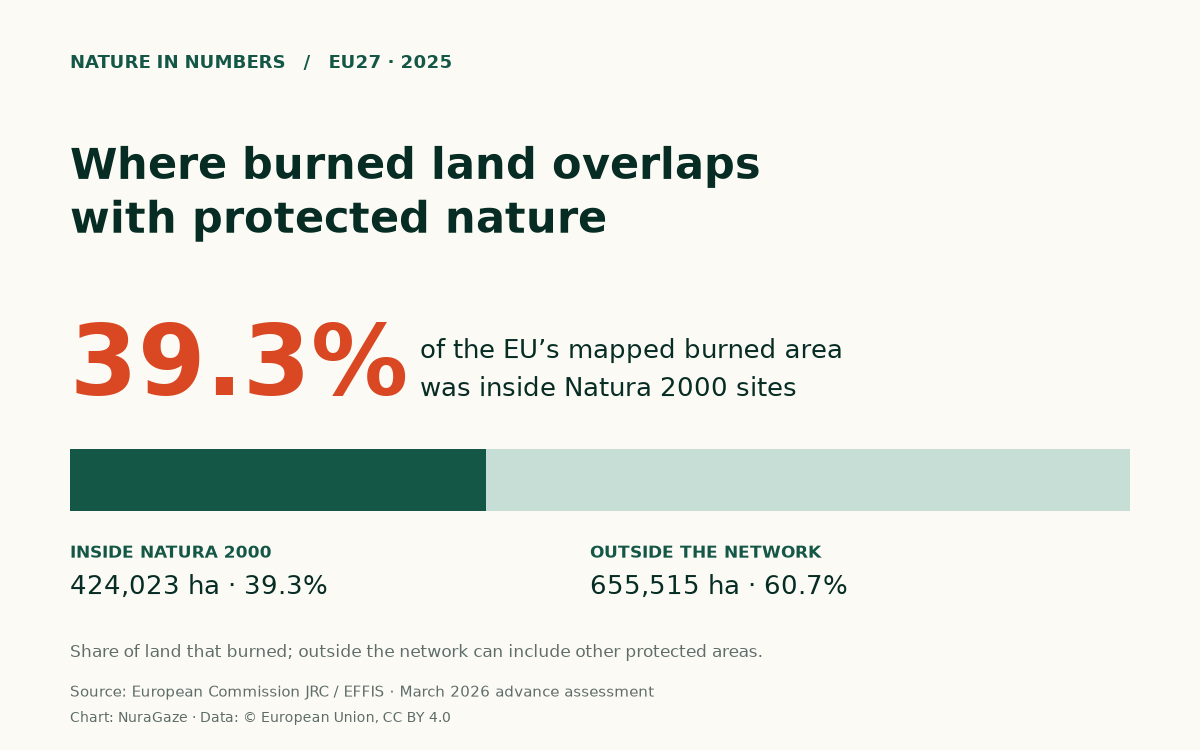
These figures cover the EU’s 27 member countries and Natura 2000 specifically. Land outside that network can have other forms of protection, including national designations. The 39% figure describes the network’s share of burned land. It does not mean that 39% of all protected land burned.
What Natura 2000 protects
Natura 2000 brings together places selected to conserve valuable and threatened habitats and species. It includes landscapes where people live and work, and activities can continue where they are compatible with conservation objectives. By the end of 2023, the network contained 27,165 sites and covered 18.6% of EU land. The European Environment Agency records the network’s extent.
That provides useful context: a network covering less than one-fifth of EU land accounted for almost two-fifths of the mapped burned area in 2025.
The comparison needs care. Protected sites differ from the rest of the landscape in their vegetation, location and climate. These percentages alone cannot tell us whether protection increases or reduces fire risk. A meaningful assessment would compare places with similar conditions and examine how they are managed.
They do, however, show that a substantial part of the year’s fire footprint overlapped with land designated for conservation.
What a burned-area map shows
Measuring that footprint starts with satellite images. The European Forest Fire Information System, known as EFFIS, uses imagery to identify and map burned areas. This provides a consistent way to examine the extent of burning across countries. Its maps are estimates, and the burned-area product can include prescribed or environmental burns as well as wildfires.
The total used here includes smaller mapped fires. EFFIS’s historical-comparison series excludes fires under 30 hectares and therefore gives a different 2025 total. The figures in this article all use the same advance-assessment totals.
What happened to the ecosystem?
A map of burned land leaves an important question unanswered: what happened to the ecosystem?
Fire affects different habitats in different ways. Some ecosystems have evolved with periodic fire, and certain plants and animals depend on or benefit from it. The European Commission’s guidance on Natura 2000 recognises that low- or moderate-intensity fires in adapted ecosystems should not automatically be treated as ecological deterioration. In some circumstances, allowing natural recovery can be appropriate.
More frequent or severe fires can create a different outcome. They can disrupt the conditions that allow vegetation to recover and affect habitats, soils and water. Understanding the consequences requires looking at the ecosystem, the fire’s intensity and the pattern of previous fires. A hectare burned is a measure of area affected; it is not a complete measure of biodiversity lost. The OECD’s assessment of wildfire impacts explains why these ecological differences matter.
Planning for protected landscapes
For the people managing protected landscapes, this makes preparation especially important. Measures need to reflect what each site is trying to conserve, alongside the risks to neighbouring communities and infrastructure.
The European Environment Agency recommends approaches adapted to local conditions, including managing vegetation, encouraging more resilient forest structures and planning for recovery. These measures work best when landowners, conservation teams and other local stakeholders are involved early.
Monitoring adds another part of that preparation. Cameras, satellites and sensors can help identify possible fires and provide information for response teams. Their usefulness depends on coverage, communications and the ability to verify an alert and act on it. Earlier detection may enable a quicker response, while the outcome still depends on conditions and available resources. The US GAO’s overview of wildfire detection describes these opportunities and limitations.
For a park or conservation area, practical planning means deciding which habitats need particular attention, where visibility is limited, who checks a possible detection and how that information reaches responders. Those decisions give monitoring a clear purpose within the site’s wider conservation plan.
Our guides to comparing detection methods and assessing camera coverage explore those practical questions.
Sources & further reading
- 2025 was EU’s most destructive wildfire season on record European Commission Joint Research Centre, 31 March 2026
- Advance report on forest fires in Europe, Middle East and North Africa 2025 European Commission Joint Research Centre, 2026; JRC146199
- Natura 2000 sites designated under the EU Habitats and Birds Directives European Environment Agency; network figures at the end of 2023
- Designated terrestrial protected areas in Europe European Environment Agency
- Rapid Damage Assessment: how burned areas are mapped European Forest Fire Information System (EFFIS)
- Guidance on Natura 2000 and climate change European Commission, 2026; section 2.4
- Understanding wildfire risk in a changing climate OECD, 2023; section 2.5.2
- How to make European forests resilient to wildfires by working with nature European Environment Agency
- Science & Tech Spotlight: Wildfire Detection Technologies US Government Accountability Office, 2025
Chart and calculations: NuraGaze, using JRC / EFFIS data, © European Union, reused under CC BY 4.0. Data scope, calculations & reuse credits.
NuraGaze provides wildfire early-warning software and monitoring systems. This article explains public data and does not estimate the damage a detection system would have prevented.