Forests in figures
Which countries lose the most forest to fire?
Five countries account for nearly 90% of global tree-cover loss caused by fire. The figures reveal its scale, and why the meaning of forest loss matters.
Russia and Canada have lost the largest areas of tree cover to fire since 2001. Together with the United States, Brazil and Australia, they account for nearly 90% of global tree-cover loss caused directly by fire between 2001 and 2025.
Over those 25 years, fires caused approximately 162 million hectares of tree-cover loss worldwide. That is 1.62 million square kilometres. The five leading countries account for most of that total, according to the World Resources Institute’s analysis of University of Maryland satellite data.
The five leading countries
The country comparison
Tree cover lost directly to fire
2001–2025 · cumulative national totals · million hectares

| Country | Million hectares |
|---|---|
| Russia | 65 |
| Canada | 46 |
| United States | 14 |
| Brazil | 14 |
| Australia | 7 |
The United States and Brazil have different totals that round to the same figure. The source’s ranking is retained.
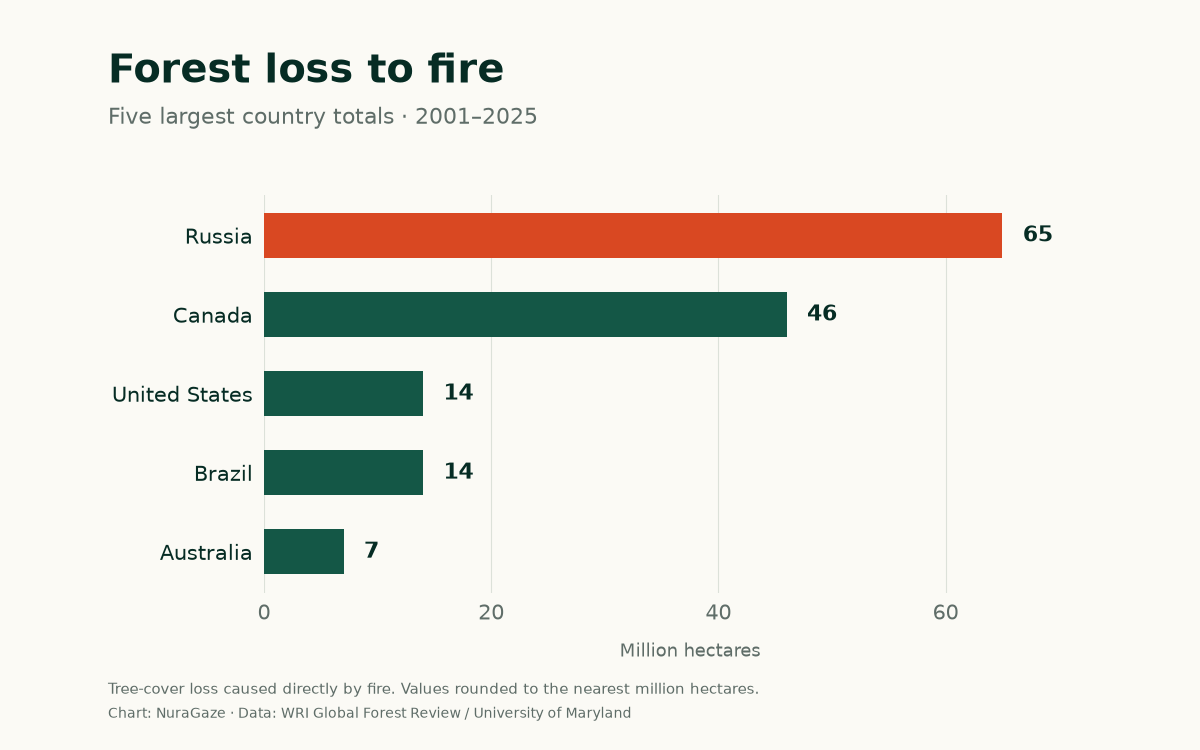
These numbers describe the area lost across each country. A country with extensive forests can record a large total even when the proportion affected is relatively small. To compare the pressure on forests fairly, we also need to consider how much forest each country has and how frequently particular areas burn.
What does “forest loss” measure?
The meaning of “loss” matters, too. Researchers track places where fire removes all or most of the upper layer of trees—the canopy. Their measurements include natural forests and plantations. A fire that burns grassland, or passes beneath trees without substantially removing their canopy, will not appear in this measure of tree-cover loss. Trees cut down and subsequently burned are also excluded from the fire category, because cutting was the direct cause of their removal. WRI’s methods explain these distinctions.
Crucially, tree-cover loss can be followed by regrowth. These figures therefore do not mean that every hectare has permanently ceased to be forest. They measure a major disturbance to tree cover, without subtracting subsequent recovery.
Different forests, different impacts
Russia and Canada’s position reflects the enormous scale of their northern, or boreal, forests. Fire is a natural part of these ecosystems, but warmer conditions, drought and longer fire seasons are changing how they burn. Canada’s exceptional 2023 season illustrates the scale: almost 7.8 million hectares of tree cover were lost to fire, around six times its annual average for 2001–2022, according to WRI’s forest-fire analysis.
Brazil presents a different picture. Humid tropical forests have historically been protected by abundant rainfall and are poorly adapted to fire. Fires used in agricultural activities can escape into surrounding forests, particularly during dry conditions. Forest fragmentation and degradation can make those remaining areas more vulnerable. The result is that similar numbers of hectares lost can represent very different ecological problems. WRI’s analysis explores these tropical fire patterns.
The United States and Australia add another range of landscapes to the picture. Fire plays an ecological role in many of their forests, while severe events can threaten both ecosystems and nearby communities. Recovery depends on the forest involved, the severity of the fire and the conditions that follow. Global Forest Review describes these differences.
What recent figures show
Recent figures show why fire deserves close attention. In 2025, fire accounted for 42% of all global tree-cover loss. That is a share of the tree cover lost during one year—not a claim that 42% of the world’s forests burned. WRI also notes that smoke and haze can delay satellite detection, so some loss recorded in 2025 came from fires late in 2024.
Countries outside the top five can still face serious consequences. In Spain and Portugal, around 60% of tree-cover loss recorded in 2025 was caused by fire. A global ranking based on total hectares can therefore obscure how significant fire has become within a smaller country. Read WRI’s European findings.
Our guide to whether wildfires are getting worse explains how burned area, extreme events, emissions and human losses each reveal a different part of the picture.
What this means locally
For organisations managing forests, parks or infrastructure, national statistics provide context. Decisions about protection need a closer view: where vegetation is drying, which areas are difficult to observe, what assets are exposed and how an alert would reach the people responsible for responding.
Cameras, satellites and ground sensors can contribute different kinds of information. Earlier detection may help teams respond sooner, but its value depends on reliable verification, a usable location and an effective response process. Monitoring belongs alongside vegetation management and other measures to reduce fire risk. The US Government Accountability Office’s technology review describes these opportunities and limitations; our guide to comparing detection methods covers the practical questions.
Sources & further reading
- Forest Degradation: tree-cover loss caused by fire, 2001–2025 World Resources Institute, Global Forest Review; updated 29 April 2026
- Global Forest Review: data and methods World Resources Institute, with University of Maryland satellite data
- The Latest Data Confirms: Forest Fires Are Getting Worse World Resources Institute; updated 4 August 2026
- Tropical Rainforest Loss Slowed in 2025, but Fire is a Growing Threat to Forests Worldwide World Resources Institute, Forest Pulse; 29 April 2026
- Science & Tech Spotlight: Wildfire Detection Technologies US Government Accountability Office; 1 May 2025
Sources checked on 28 October 2026. Country figures are rounded labels transcribed from WRI’s chart, not a full-precision dataset. The chart and table use the same values. Chart sources, scope & precision notes.
NuraGaze provides wildfire early-warning software and monitoring systems. These public statistics do not measure the performance of any detection product.