Forests in figures
How much protected forest is affected by wildfire?
About 38% of Italy’s burned forest in 2025 lay inside protected areas. Three years of official figures show the scale, the variation and what hectares alone cannot tell us.
Thousands of hectares of protected forest can be affected in a single year. In Italy, the environmental agency ISPRA reported 4,696 hectares of forest burned within protected areas in 2025. That is almost 47 square kilometres, and about 38% of the country’s forest area mapped as burned that year. ISPRA’s annual report records the figures.
Italy offers a useful case study because its annual reports distinguish forests from other habitats and identify the overlap with conservation areas. The results help answer both how much woodland was affected and what the numbers mean for the people responsible for it.
Three years in figures
The reported forest area burned within protected sites fell sharply between 2023 and 2024, then rose by about 45% in 2025. Even after that increase, the 2025 total remained below 2023.
The annual comparison
Forest burned within protected areas
Italy · 2023–2025 · reported full-year totals in hectares

| Year | Forest burned (ha) |
|---|---|
| 2023 | 6,732 |
| 2024 | 3,232 |
| 2025 | 4,696 |
Download data (CSV) · Download chart (PNG)
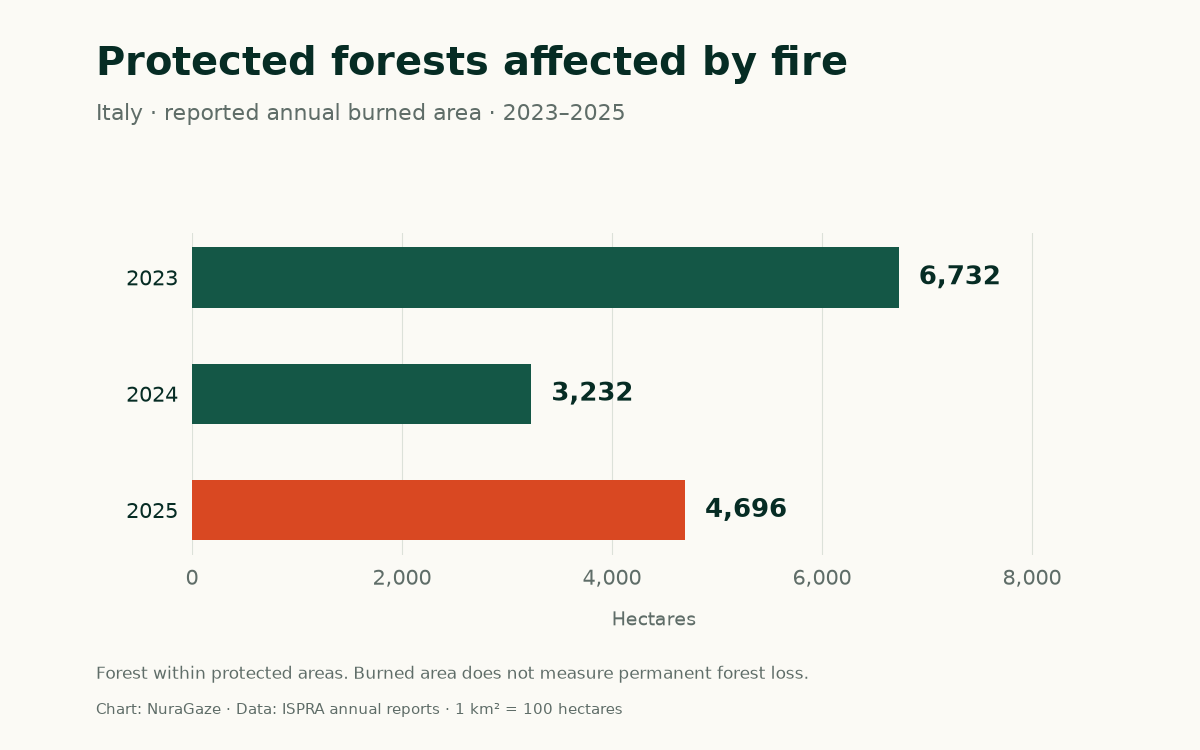
These are ISPRA’s reported aggregate estimates. Some category breakdowns in the reports are inconsistent; this comparison uses the aggregate rows throughout. Read the data sources and limitations.
Three observations cannot establish a long-term trend. They do show why choosing a single year can change the story: 2025 looks worse when compared with 2024, and better when compared with 2023. A longer record is needed to understand how the underlying pattern is changing.
How the forest is measured
Researchers combine three maps: where burning was detected, where forest grows, and where protected-area boundaries lie. The overlapping area gives an estimate of protected forest affected by fire.
ISPRA uses EFFIS burned-area observations and its own forest classification. This covers several kinds of woodland, including deciduous forests, evergreen broadleaf forests and conifers. Some tall Mediterranean scrub is included in the forest classes. The definition matters when comparing these totals with statistics produced by other organisations.
Protected designations can overlap too: the same woodland may belong to a park and a Natura 2000 site. Adding every designation’s figures would risk counting land more than once. That is why the chart uses the agency’s reported all-protected aggregate.
Satellite mapping also has limits. Small features can fall below the imagery’s resolution, and the underlying EFFIS product can include prescribed and environmental burns. EFFIS explains these limitations. These figures describe the mapped fire footprint and should be read with that scope in mind.
What happens after a fire?
A burned hectare tells us the size of the area affected. It does not tell us how many trees died, which species survived or how quickly the forest will recover.
Some ecosystems have evolved with fire and can recover naturally. Others are much more sensitive. Severe or repeatedly occurring fires can make recovery harder, damage habitats and soils, and contribute to lasting changes in vegetation. The OECD’s assessment of wildfire impacts explains why the ecological consequences differ so much between places.
For conservation, the next questions are therefore local: which habitats burned, how severely were they affected, and what is growing back? Tracking recovery gives the area statistic its ecological meaning. Treating every burned hectare as permanently lost forest would hide those differences.
What this means for forest managers
The figures give managers a reason to examine their own sites closely. They do not establish whether protected status itself increases or reduces fire risk. A fair comparison would need to account for climate, vegetation, terrain and management.
The European Environment Agency recommends adapting prevention and restoration to local conditions. That can include managing vegetation and encouraging forest structures that are more resilient to fire, with conservation teams and local communities involved in planning.
Monitoring supports those decisions. Cameras, satellites and sensors can help identify possible fires, but an alert also needs a usable location, verification and a route to responders. The US GAO’s technology review describes both the potential for earlier response and the difficulties of coverage and communication in remote places.
For a protected forest, a practical starting point is to identify sensitive habitats, areas that are difficult to observe and the team responsible for checking alerts. Our guide to fire-camera coverage explains the visibility questions. For a wider geographic view, explore burned land within Europe’s Natura 2000 network.
Sources & further reading
- Ecosistemi terrestri ed incendi boschivi in Italia: Anno 2023 ISPRA; 2023 calendar year, table 2.6
- Ecosistemi terrestri ed incendi boschivi in Italia: Anno 2024 ISPRA; 2024 calendar year, tables 2.2 and 2.8
- Ecosistemi terrestri ed incendi boschivi in Italia: Anno 2025 ISPRA; 2025 calendar year, sections 2–3, published in 2026
- Incendi boschivi: nel 2025 aumenta la superficie andata in fumo ISPRA; summary of 2025 findings
- Rapid Damage Assessment: burned-area mapping and limitations EFFIS / Copernicus Emergency Management Service
- Understanding wildfire risk in a changing climate OECD, 2023; sections 2.2 and 2.5.2
- How to make European forests resilient to wildfires by working with nature European Environment Agency
- Science & Tech Spotlight: Wildfire Detection Technologies US Government Accountability Office, 2025
Sources checked on 29 October 2026. Italian reports cover complete calendar years. Chart and calculations: NuraGaze, using ISPRA’s published aggregate figures. Source tables, conversions and limitations.
NuraGaze provides wildfire early-warning software and monitoring systems. These statistics describe reported burned areas and do not measure the performance of a detection product.