Wildfires in numbers
What starts wildfires? Human activity and lightning in numbers
People caused most reported US wildfires in 2025. Lightning-caused fires burned more land. Two charts explain what both figures mean for prevention and monitoring.
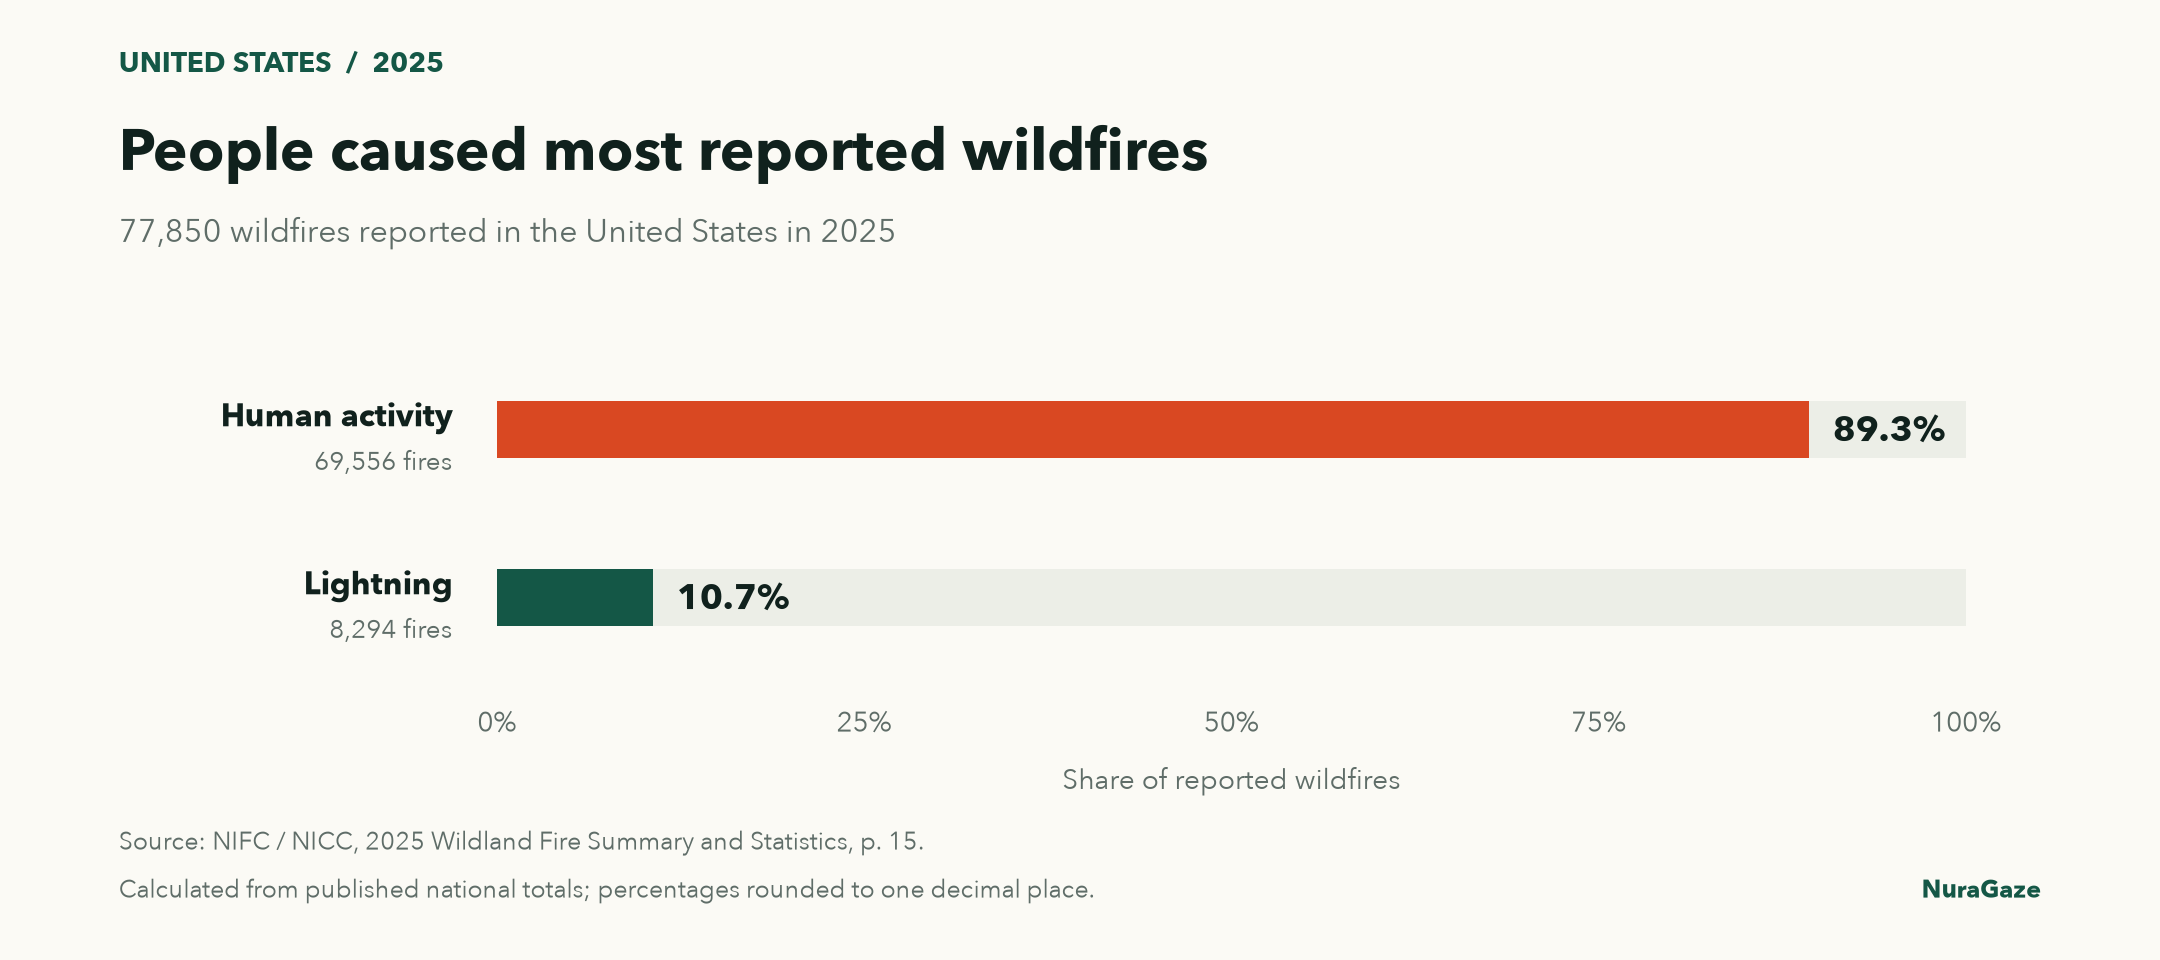
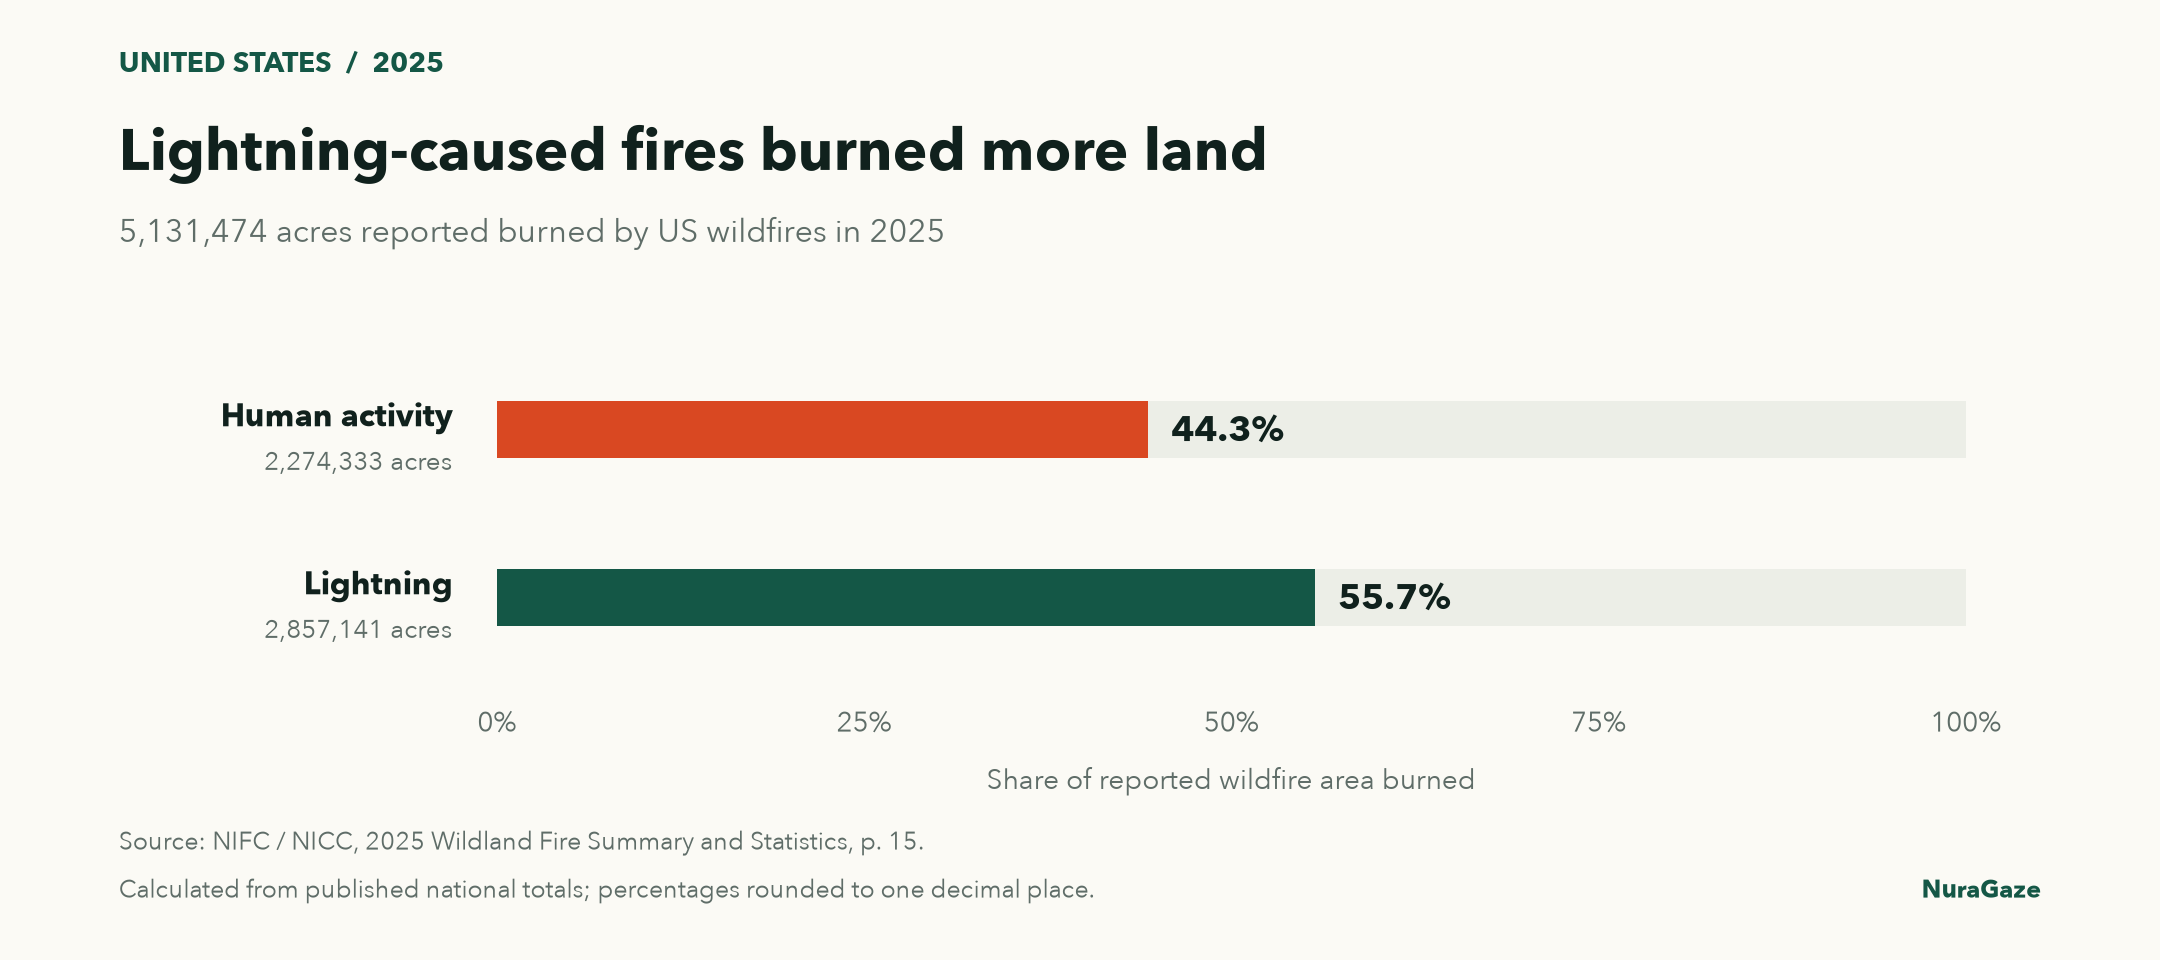
Nearly nine in ten wildfires reported in the United States in 2025 were caused by human activity. Lightning caused just over one in ten, yet those lightning-caused fires accounted for more than half of the land burned.
These percentages are calculated from the National Interagency Fire Center’s human-caused and lightning-caused fire totals.
For anyone responsible for a forest, park, farm or infrastructure site, both figures matter. Counting fires helps identify the most frequent sources of ignition. Measuring the area they burn reveals a different part of the problem: how far those fires spread.
What starts the most fires?
NIFC recorded 77,850 wildfires in 2025: 69,556 attributed to human activity and 8,294 to lightning. That gives human activity an 89.3% share of reported fires, compared with 10.7% for lightning. These are US figures for a single year, not a worldwide average or a forecast for any particular site.
Chart 1 / 2
People caused most reported wildfires
United States, 2025 · 77,850 reported fires

View chart 1 data & downloads
Download data (CSV) · Download chart (PNG)
| Cause | Reported fires | Share |
|---|---|---|
| Human activity | 69,556 | 89.3% |
| Lightning | 8,294 | 10.7% |
“Human-caused” covers a wide range of activities. NIFC’s cause categories include campfires, debris burning, equipment and vehicle use, power infrastructure, fireworks and arson. Some ignitions are accidental; others are deliberate. The headline percentage does not tell us how much each activity contributed, so it cannot be read as a measure of arson. Read NIFC’s guide to wildfire causes.
Which fires burn more land?
The burned-area figures show why lightning still deserves close attention. Human-caused fires burned 2,274,333 acres, or 44.3% of the national total. Lightning-caused fires burned 2,857,141 acres, or 55.7%. Together, they account for the 5,131,474 acres NIFC reported burned in 2025.
Chart 2 / 2
Lightning-caused fires burned more land
United States, 2025 · 5,131,474 reported acres burned

View chart 2 data & downloads
Download data (CSV) · Download chart (PNG)
| Cause | Reported acres burned | Share |
|---|---|---|
| Human activity | 2,274,333 | 44.3% |
| Lightning | 2,857,141 | 55.7% |
How do regions compare?
Location changes the picture substantially. The table below compares the share of reported fires in four NIFC geographic reporting areas in 2025. Percentages are calculated from each area’s published human and lightning counts.
| NIFC reporting area | Human-caused fires | Lightning-caused fires |
|---|---|---|
| Eastern Area | 99.4% | 0.6% |
| Southern Area | 97.2% | 2.8% |
| Northwest | 63.6% | 36.4% |
| Alaska | 46.7% | 53.3% |
In Alaska, lightning caused slightly more than half of reported fires but accounted for 99.8% of the area burned. In the Southern Area, it caused 2.8% of fires and accounted for 16.1% of burned area. A national average therefore needs local context before it guides a management plan.
Why keep watching after lightning?
There are practical reasons to watch for fires after lightning. A strike can start a fire in a remote place that is difficult to reach. Some fires then smoulder for days before becoming more visible. These delayed fires are known as holdovers. Research supported by the US National Science Foundation found that lightning-started fires can develop even when a storm brings some rain. The storm passing does not necessarily mean the danger has passed. Read NSF’s explanation of lightning and holdover fires.
The annual totals alone cannot explain why one fire becomes large while another stays small. A 2025 study of historical US Forest Service records found that ignition patterns differed across regions, and that the sources responsible for frequent fires could differ from those associated with the largest burned areas. This supports looking at local causes and conditions together. Read the US Geological Survey research.
Burned area also has limits as a measure of harm. It does not describe losses to homes, disruption to a business or the ecological effects of a fire. Fire can be part of a healthy ecosystem; land managers assess its effects and the threats to people and property when deciding how to respond. Read the US National Park Service’s explanation.
What does this mean for prevention?
For prevention, the large human contribution makes everyday practices worth attention. Maintaining vehicles and equipment, following local restrictions, and ensuring staff and visitors understand campfire and debris-burning rules all address recognised ignition sources. The right priorities depend on which activities actually occur on and around the site. See NIFC’s prevention guidance.
For lightning, preparation includes deciding how remote areas will be monitored after storms. For either cause, an alert needs a practical response: someone to verify the event, establish its location and pass useful information to the appropriate teams. Cameras and sensors can support that process, alongside wider prevention and land-management work. Read the US GAO’s wildfire detection overview.
For organisations managing landscapes or infrastructure, the useful question is which ignition sources are most relevant locally, and where a developing fire could go unnoticed. That is a practical starting point for planning monitoring coverage.
How to read the figures
Figures refer to reported US wildfires in 2025. Percentages are calculated from NIFC’s published cause totals and rounded to one decimal place. Sources checked on 28 October 2026.
Calculations, source notes & downloads
National percentages use the published national totals; regional percentages use each area’s own cause counts. Counts measure reported fires, while acres measure the area burned.
The regional human-caused counts in the source sum to six more fires than the published national total. The national percentages shown here use the published total and are unchanged at one decimal place. The data download also uses the annual report’s Northwest lightning acreage of 328,309; the web table lists a different figure. These discrepancies and the source values are documented in the notes.
Sources & further reading
- Human-caused wildfires: counts and acres by geographic area National Interagency Fire Center (NIFC)
- Lightning-caused wildfires: counts and acres by geographic area National Interagency Fire Center (NIFC)
- Wildfires and acres: national annual totals National Interagency Fire Center (NIFC)
- Wildfire investigation: common causes and prevention guidance National Interagency Fire Center (NIFC)
- 2025 Wildland Fire Summary and Statistics annual report National Interagency Coordination Center (NICC), printed page 15
- Dry lightning can spark wildfires even under wetter conditions US National Science Foundation, 19 September 2023
- Regional patterns in US wildfire activity: the critical role of ignition sources Syphard and colleagues, Environmental Research Letters (2025); USGS publication record
- Wildfire causes and evaluations US National Park Service
- Science & Tech Spotlight: Wildfire Detection Technologies US Government Accountability Office (2025)
NuraGaze provides wildfire early-warning software and monitoring systems. These statistics describe reported fires; they do not measure the effectiveness of a NuraGaze deployment.